5 Information Collection
5.1 Purpose of this chapter
This chapter is small, but it covers a crucial aspect of our valuation task. We are now at the stage of our analysis where we are switching from “understanding the past” to “forecasting the future”. Figure 5.1 shows how we position the task of collecting information as the glue between all the steps in our analysis. It also shows that there are feedback loops—we learn something from new data and revisit previous steps. During this process, we get new ideas about what information might be useful to collect. The new data reshape our views about the current state of the firm and/or its future prospects, and so on.

High-quality data are obviously important for this process to work well. We all have heard the cliché phrase that “better data leads to better decisions”. What is less discussed is that we first need to find out (1) what information we need, (2) whether we can even get this information (in time), (3) how can we get the data, and (4) what adjustments we need to do in our analysis going forward if we cannot get the information. We will spend some time on each of these four points in this chapter.
5.2 The importance of high quality data
In our experience, bright young analysts in charge of the financial model often run into either of two issues: The first is that they design a model that is too simple—just extrapolating past ratios, adjusted by intuition. This often happens if they do not have enough experience to spot the important drivers and how to model them. The second issue is the opposite. They design a model that is complicated—modeling all drivers in detail—and then cannot collect information on those drives. The result is that the model is hard to reason about and is full of equally loose assumptions as in the simple model. This also makes it harder to reason about the sensitivity of the model to those assumptions. The problem in the second case is that the analysts thought only about theoretical determinants and not about data when building the model. Imagine building a forecasting model for H&M sales by region. You might think of breaking down sales as follows:
\[ \begin{aligned} Sales_{region, t} = & \text{ Number shoppers in shopping area}_{region, t} \\ & \cdot \text{ Probability shopper enters H\&M store}_{region, t} \\ & \cdot \text{ Probability of purchase}_{region, t} \\ & \cdot \text{ Average basket size of a H\&M purchase}_{region, t} \end{aligned} \tag{5.1}\]
This is not an uncommon way to model sales in retail. But it requires a lot of regional data to be available. Firms may have this data available for internal projections. External analysts might not (or paying for the data is outside of the allocated budget). If we cannot collect dependable data on, for example, footfall in the shopping areas we care about, then already the first driver of future sales will be subject to guesswork and inaccuracy.
We thus need to caveat slightly what we discussed in previous chapters. It is crucial to find out what the key determinants of profitability, investment growth potential, and risk are for a company. For forecasting future performance, we now need to think about designing a financial model that is as accurate and as defendable as possible. To us this implies:
- It needs to be easy-ish to reason about.
- Important assumptions should be visible as such.
- Key modelling assumptions should be supported by as much high-quality data as possible.
Thus, we need now to think about what drivers to model both in terms of dependable data available and conceptual fit to the business! There needs to be a healthy balance between model complexity and data-hungriness. It is also very satisfying when the balance is just right. It is as much art as science and requires a good understanding of the business as well as creativity.
5.3 Analysing means comparing
Let us talk a bit more about what “good data” actually means. In the forecast model in Equation 5.1, above, we need to prepare forecasts for model parameters, such as the probability of a purchase. On what do we base these forecasts? If we were a controller at H&M, we might be able to use company internal data from existing stores as a basis for this probability (assuming H&M tracks how many people enter their stores). Even in this case, using historical numbers as a basis for our forecast of the future probability of a purchase, we would make an assumption by comparison. We would assume that the future will be like the past for H&M. We need to make sure that this is a reasonable assumption. If we are an external analyst, we need to get data for our assumption from somewhere else. We need to find data from a different source about H&M or a different, comparable situation/firm. Especially for firms in transition, we often want to base our forecasts on data for firms that are in a similar situation to the one our firm is transitioning to.

Forecasting—even machine-learning-based forecasting—is nothing but identifying similar situations in history and assuming that something similar will happen again. For example, when Netflix CEO Hastings says in a conference call that the addressable market for Netflix is 700-900 million households, that figure is based on a comparison to the market for Pay TV and assuming that the streaming market is as large. Figure 5.2 shows something you should remember. For most products and services, market development has an S-shaped time series.
5.4 Focused information collection
By now, we hope that the top-down structure we advocate is obvious. Figure 5.3 shows how we move from core value drivers to identifying important financial subcomponents to isolating the core business determinants driving those subcomponents. The last step, finding useful determinants with enough information to reason about, is where we are now. All the structure that we discussed in the previous three chapters—if done well—pays off at this stage. You should now have a decent idea about which expenses, assets, etc. are crucial for ensuring growth and profitability. And you should understand the business well enough by now to be able to reason about the determinants of those items. If not, find out what you need to know to close these gaps in your understanding and focus your information collection on those gaps first.

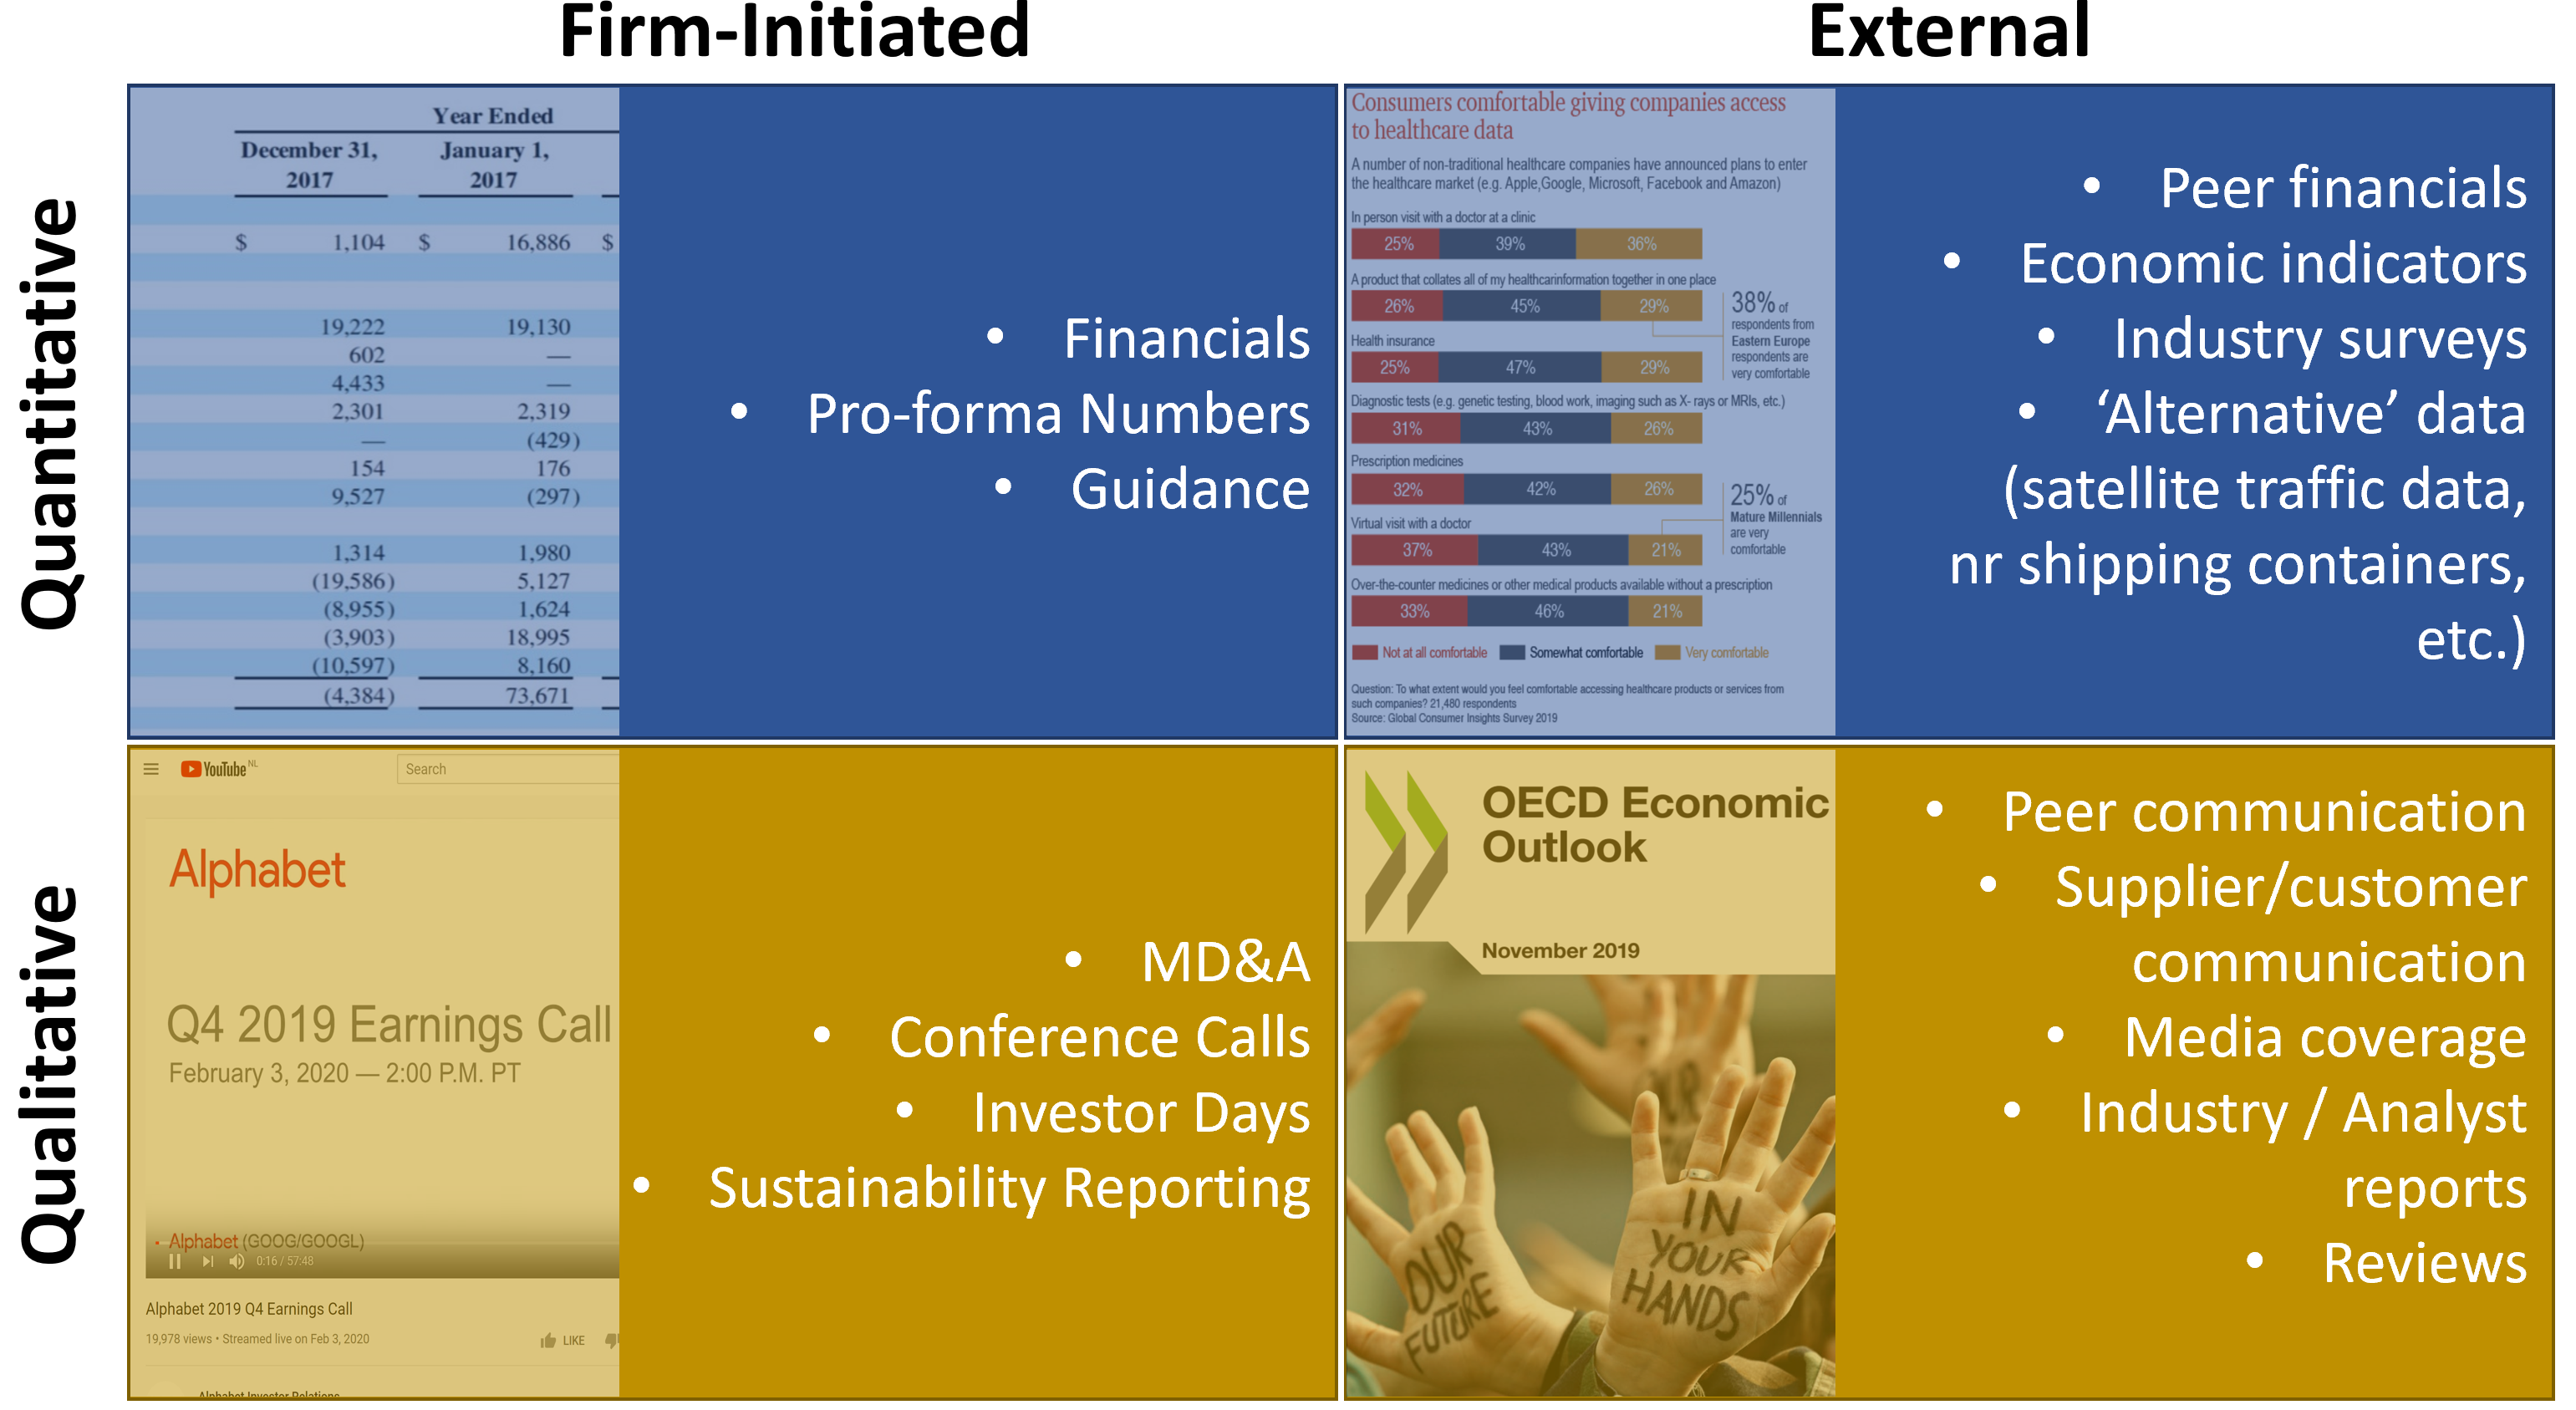
Once we have an idea of what possible determinants to learn more about and what determinants we might build our forecast mode around, we need to find information on them. This is really the core message of this chapter. There is an ocean of potentially useful information out there to inform our modeling. Unfortunately, which information will be useful depends on the firm’s context: its market, competition, and so on. However, there are some information sources that are useful more often than not. Figure 5.4 classifies the most commonly used information sources into four different types. Each type has some special characteristics that we think are worth highlighting next.
5.5 Firm initiated information
Table 5.1 shows the responses of a survey of 603 US investor relations officers to the question “How important are the following for conveying your company’s message to institutional investors?”. The response scale goes from 6 (very important) to 0 (not important).

Table 5.1 is about communication at the firm level. And while annual reports are considered important (average rating 4.58), more direct communication channels are considered even more important (such as private phone calls).
This highlights an important difference between firm-initiated information and information external to the firm. Management is probably best informed about the economic situation of the firm. But there are also clear, strategic reasons why a firm’s management might not want to be fully open about the economic situation—or at least prefers more direct communication channels. An obvious reason is that competitors can also access public information. Another reason is strategic communication with existing and potential shareholders or other stakeholders. For example, given Apple’s large amount of revenues ($366bn in 2021), advertising expenses of $3.5bn would be less than 1% of revenues and therefore not material enough to be required to be broken out of SGA. This might still be an interesting number for some models, and it is in Apple’s discretion to still communicate their advertising budget voluntarily. The fact that Apple chooses not to do so is informative in its own right—it either does not think it is useful for investors to know, or does not want to show it for competitive or strategic reasons. In this case, unless you think advertising is crucial for Apple, there are probably drivers of sales and expenses that are more important to get right.
Still, one should always have the strategic angle of firm-initiated data in mind. The following is an excerpt of Meta’s Q4 2021 earnings release (formerly Facebook):
Fourth Quarter and Full Year 2021 Operational and Other Financial Highlights
- Family daily active people (DAP) – DAP was 2.82 billion on average for December 2021, an increase of 8% year-over-year.
- Family monthly active people (MAP) – MAP was 3.59 billion as of December 31, 2021, an increase of 9% year-over-year.
- Facebook daily active users (DAUs) – DAUs were 1.93 billion on average for December 2021, an increase of 5% year-over-year.
- Facebook monthly active users (MAUs) – MAUs were 2.91 billion as of December 31, 2021, an increase of 4% year-over-year.
- Ad impressions and price per ad – In the fourth quarter of 2021, ad impressions delivered across our Family of Apps increased by 13% year-over-year and the average price per ad increased by 6% year-over-year. For the full year 2021, ad impressions increased by 10% year-over-year and the average price per ad increased by 24% year-over-year.
- Capital expenditures – Capital expenditures, including principal payments on finance leases, were $5.54 billion and $19.24 billion for the fourth quarter and full year 2021, respectively.
- Share repurchases – We repurchased $19.18 billion and $44.81 billion of our Class A common stock in the fourth quarter and full year 2021, respectively. As of December 31, 2021, we had $38.79 billion available and authorized for repurchases.
- Cash and cash equivalents and marketable securities – Cash and cash equivalents and marketable securities were $48.0 billion as of December 31, 2021.
- Headcount – Headcount was 71,970 as of December 31, 2021, an increase of 23% year-over-year.
— Excerpt of Meta’s Q4 2021 earnings release, February 2, 2022
Meta gives out these numbers because they (DAU, Ad impressions, etc.) are considered important determinants for Meta’s business. Either investors ask for them or Meta provides them pro-actively. Often such data is very useful. However, one always needs to double-check whether the numbers are actually informative. It can also be the case that among a wider selection of possible determinants, firms choose those that are more likely to look good on a continuous basis. Companies like you to use determinants (e.g., DAUs) that make them look good. These numbers are still quite informative, but one should not be too distracted by them. Continuously question what aspects the firm provided determinants might not be informative about.
5.6 Firm external information
We already discussed that while a firm’s management is most likely to know best about the current situation of the firm, it is not always in the best interest of the firm to be completely transparent about it. Thus, one purpose of other external information is to corroborate and check firm communication. In addition, external information is often more timely than firm disclosures. For example, an increase in oil prices will have implications for airline expenses, which will only be communicated quarterly (ignoring the significant hedging activities of airlines for the purposes of illustration). Keeping an eye on external information sources is important to spot early warning signals, but also to inform short-term forecasts.
With external information, the problem of an “ocean of information available” is especially acute. Today, there is a large industry that provides “alternative data” to investors looking for an information edge. Examples are satellite data of parking lot occupancy in shopping malls to container ship load estimates. There seems to be a fear by especially quantitative investors that this is an arms race:
“You may not get rich by using all the available information, but you surely will become poor if you don’t.”
— Attributed to: Jack Treynor, former editor of the Financial Analysts Journal
“We’re in an ocean of information and navigating it can be difficult. But our experience as fundamental investors has really helped us to focus on the right things.”
— Lee Ainslie, Maverick Capital, in this ft.com article
The last quote reiterates our point from Section 5.4 that focus and expert knowledge are crucial to find and leverage the right information. Is expensive satellite data on parking lot occupancy the best way to monitor demand in stores that you analyze? Maybe it is, maybe it is not. But you should be able to reason to an defendable answer based on your expert knowledge, your FSA skills, your assessment of the data’s quality, and your grasp of what other (high quality) data sources are out there.
You should apply such reasoning to all data sources. Consider competitor data, which is often very useful for any analysis. What do we need it for? We need it to better understand the development of our firm’s markets and to better understand competitive dynamics (market share, profitability, risk). We have certain comparisons in mind and certain information needs. This should dictate a guided search through competitor data.
5.7 Qualitative vs quantitative information
Qualitative data, such as interviews, usually do not find extensive treatment in many textbooks. But it can be the best source of information that you can get your hands on.
Things said between the lines in MD&As or in conference calls can be the most revealing. Here is an excerpt from Peloton Interactive’s Q3 2020 Earnings call:
Heath Terry – Goldman Sachs – Analyst
Great, thanks. I just wanted to dig a little bit deeper into the supply chain discussion. If I look at the backlog that you had reported on the balance sheet in Q – for the March quarter, it would appear that you had about 95,000 bikes on order at that point. And I compare that to the roughly 165,000 that are implied in the guidance for the June quarter. I’ve got to imagine you guys are going to sell a lot more and probably already have just in the month of April roll out more than 65,000 or 70,000 bikes. Is that-is the guidance for Q2 an indication of sort of what that [Indecipherable] where the supply chain sits now or sort of where the capacity of the supply chain sits now and could you give us a sense of sort of all of these efforts that you have to expand the capacity of the supply chain sort of where supply chain capacity could be in September, in December, particularly in December given that you won’t necessarily have the ability to pre-build the way you normally would ahead of a typical holiday season. Is there a number you can see yourselves getting to in terms of the ability to deliver the supply chain capacity to deliver over the over the next six months or so?
Jill Woodworth – Chief Financial Officer
I’ll just take – I just want to make a couple point of clarification and then I think William can do a deeper dive for you on what we’re doing from a supply chain perspective. I think I’ve said in the past that it’s hard to look at our inventory and get an accurate picture of how many bikes right we have available for sale and as you can imagine order to delivery times, vary significantly across the different markets. It depends on kind of where we’re seeing certain spikes in demand and as you know we have two-and-a-half dozen warehouses across the country and now warehouses in Germany and the UK and Canada. So looking – and there’s tread inventory there. So I wouldn’t necessarily look at inventory.
Heath Terry – Goldman Sachs – Analyst
Yes, I wasn’t looking at inventory. I was looking at your deferred revenue line.
Jill Woodworth – Chief Financial Officer
Yeah, and so – and on deferred revenue, yes, we 100% entered Q4 with a pretty decent backlog and then remember any sales that are occurring in Q4 are also going to be a backlog for fiscal year ’21. So with that I don’t know with Will, you want to address some of the specifics around what we’re doing in the supply chain, but it definitely is we feel very – what I will say is we feel very good about the sales and subscriber estimates that were given for Q4 that those we feel very confident we can deliver on from a supply chain perspective.
— Peloton Interactive’s Q3 2020 Earnings Call
We like this example, because it is a great example of a smart analyst, crunching the numbers well (implications of deferred revenue combined with what is going on in the market right now) and asking a pinpoint question. The management team basically replied that the numbers are not indicative of supply. Unfortunately, for management, it seemed as if the analyst was right. Soon, customers were complaining about long wait times and missed deliveries. In November 2020, Mr. Foley, the CEO of Peloton, apologized. “It pains us that we’re underperforming”. A few months later, the company said it would push back the launch of a new treadmill, double the size of customer-service operations and start shipping exercise equipment by air to ease delays.
A final data source that we think deserves special mention is expert interviews. Especially for small firms in niche markets, finding a reliable expert and interviewing her is about the most high-quality source of information available to learn from. It is not surprising that expert interviews are a cornerstone of the analysis process at investment banks, private equity firms, and consultancies. Again, to get the most out of such interviews (they can be quite expensive) we should focus our question to possible determinants of our core value drivers (and their immediate financial drivers). We should go into such interviews only after we have done our homework and analyzed the business, conducted our ratio analysis, and learned as much as possible about the current state of the firm from the available financial and other data sources. Being prepared is essential to get the most out of it; ideally, one already has a first financial model built for forecasting. Of course, there is nothing wrong with asking broad questions (e.g., “What do you think is the most important driver of this business?”). This is a valuable strategy to ensure that we have not missed important parts of the business. But too many broad questions usually lead to a situation where we find ourselves with many remaining question marks, once we sit down with our financial model and try to construct the forecasts.
In summary, while shorter and to some extent more abstract, information collection is a crucial aspect in the whole modeling process. Focus is the key. We need to have a clear structure of the business in mind, and ideally already the beginnings of the financial model with determinants we want to forecast linked to financials and those to the core value drivers. With this structure in place, we need to methodically go through our setup and find the spots where we need more information. This guided search is the most likely to be successful.